-
How to Test Mobile Apps for Performance: A Complete Practical Guide
How to Test Mobile Apps for Performance: A Complete Practical Guide
A mobile app that crashes under load or drains the battery in two hours doesn't get a second chance. Users uninstall, leave one-star reviews, and move on. For apps in competitive spaces — especially fintech and crypto platforms where users expect real-time price feeds and instant transaction confirmations — performance isn't a nice-to-have. It's the product.
This guide walks through every layer of mobile app performance testing: the metrics that matter, the tools available for Android and iOS, how to set up a realistic test environment, and what to do when things break.
Why Mobile App Performance Testing Matters
Poor performance directly causes user churn, negative App Store ratings, and measurable revenue loss. Mobile environments introduce constraints that web and desktop apps simply don't face — limited RAM, variable network conditions, thermal throttling, and battery budgets that users guard jealously.
A crypto trading app that freezes during a market spike, or a wallet app that takes four seconds to load a transaction history, loses user trust immediately. The stakes are higher than a slow website because mobile users are often on the go, impatient, and have dozens of alternatives one tap away.
Performance testing catches these problems before launch — and keeps them from creeping back in after updates.
Key Performance Metrics to Measure
The most important mobile performance metrics are load time, CPU usage, memory consumption, battery drain, and network responsiveness. Each one tells a different story about where your app struggles.
- Load time / response time: How long it takes for the app to launch, navigate between screens, or complete a user action. Users notice anything above 2-3 seconds.
- CPU usage: High CPU consumption causes thermal throttling on mobile devices, slowing down the entire system — not just your app.
- Memory usage / memory leaks: Apps that hold onto RAM they no longer need will eventually be killed by the OS. Memory leaks are especially common in apps with complex navigation stacks or real-time data subscriptions.
- Battery consumption: Excessive background processing, frequent GPS polling, or poorly managed network calls can drain the battery noticeably — a fast path to uninstallation.
- Network responsiveness: API latency, payload size, and retry behavior under poor connectivity all affect perceived performance, particularly for data-heavy apps.
Tracking all five gives you a complete picture. Optimizing only load time while ignoring battery drain is a common trap that leaves users frustrated in a different way.
Types of Mobile Performance Testing
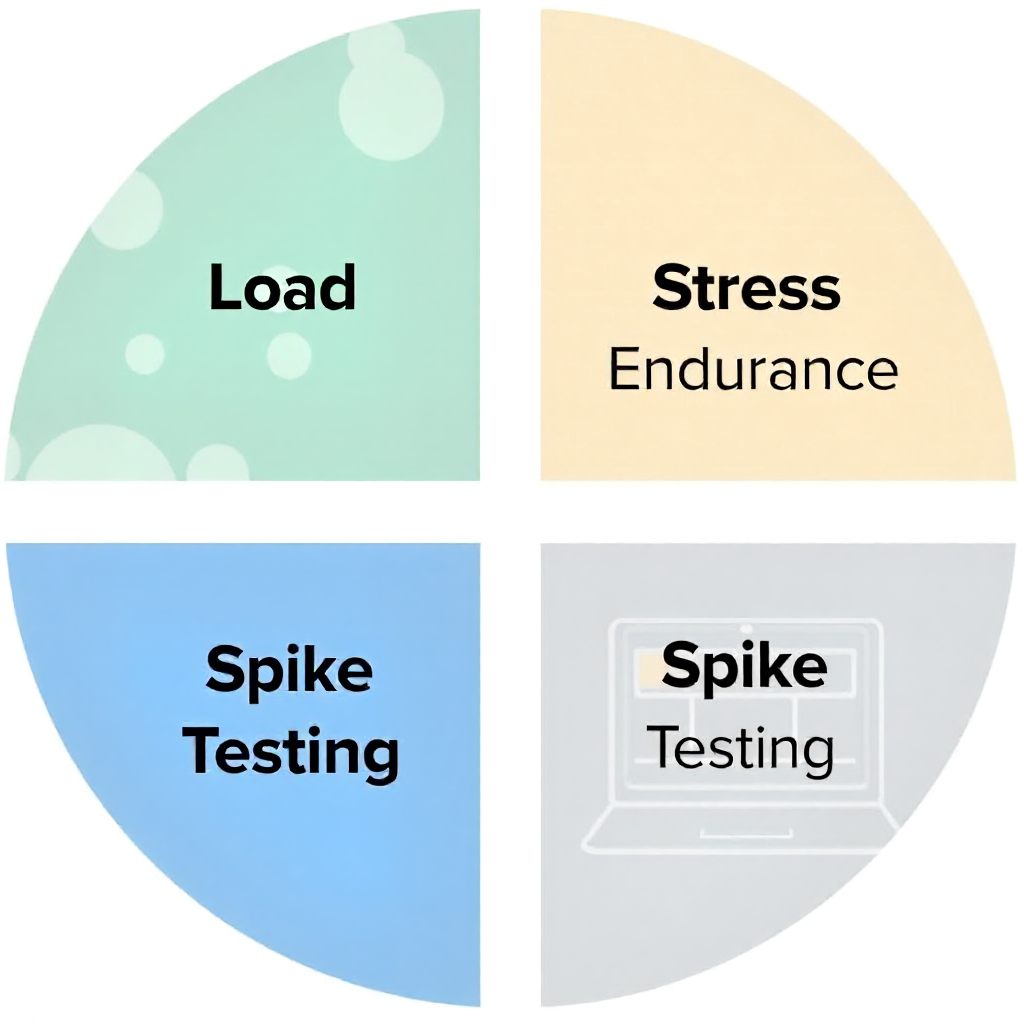
Mobile performance testing covers four main approaches: load testing, stress testing, endurance testing, and spike testing. Each targets a different failure mode.
Load testing simulates a realistic number of concurrent users to verify the app performs acceptably under expected demand. For a crypto exchange app, that means testing during normal trading hours with typical user volumes.
Stress testing pushes the app beyond its expected limits — more users, more data, more concurrent requests — to find where it breaks and how it recovers. This is where you discover whether your app crashes gracefully or corrupts data.
Endurance testing (also called soak testing) runs the app under moderate load for an extended period, often hours. This is the best way to surface memory leaks and resource exhaustion that don't appear in short test runs.
Spike testing applies sudden, extreme load increases to simulate viral traffic events or market volatility surges. If your app's backend can't handle a sudden 10x traffic spike, spike testing tells you before your users do.
Tools for Testing Mobile App Performance
The right tool depends on your platform, team size, and whether you need manual profiling or automated testing at scale. Both native and cross-platform options exist, and most serious QA workflows use a combination.
Platform-Native Profiling Tools
Android Profiler (built into Android Studio) gives real-time visibility into CPU, memory, network, and energy usage. It's the first tool to reach for when debugging performance on Android — granular, accurate, and free.
Xcode Instruments is the iOS equivalent. It includes specialized instruments for time profiling, memory allocation, energy impact, and network activity. The Leaks instrument is particularly useful for tracking down memory leaks in Swift or Objective-C code.
Automated Testing Frameworks
Appium is an open-source framework that supports automated UI testing across Android and iOS using a single codebase. It integrates with performance monitoring libraries and fits naturally into CI/CD pipelines.
Apache JMeter is primarily a backend load testing tool, but it's widely used to simulate API load that mirrors what a mobile app generates. It's effective for stress testing the server-side components that mobile apps depend on.
Firebase Test Lab runs automated tests on real devices hosted in Google's data centers. It supports both Android and iOS, generates performance reports, and removes the need to maintain a physical device lab — a practical choice for smaller teams.
How to Set Up a Performance Testing Environment
A realistic test environment requires real devices, simulated network conditions, and a defined baseline. Without these, your results won't reflect what actual users experience.
Real devices versus emulators is a genuine trade-off. Emulators are faster to configure and cheaper to scale, but they don't replicate battery behavior, thermal throttling, or hardware-specific rendering issues. For final validation before launch, test on physical devices — at minimum, one mid-range Android device and one recent iPhone, since these represent the majority of your user base.
Network throttling is non-negotiable for mobile testing. Both Android Studio and Xcode support network condition simulation. Test under 4G, 3G, and poor connectivity scenarios. Users in rural areas or on congested networks shouldn't get a broken experience.
Before running any tests, establish a performance baseline — a documented snapshot of how the app performs on a clean install under controlled conditions. Every subsequent test compares against this baseline, which is what makes regression testing meaningful.
Step-by-Step Performance Testing Process
A structured performance testing workflow moves from goal definition through remediation and retesting. Skipping steps — especially the retest — is where teams lose the gains they worked for.
- Define goals and thresholds: Set specific targets (e.g., app launch under 2 seconds, memory usage below 150MB, no ANR events under load) before writing a single test.
- Write test scripts: Use Appium or platform-native tools to script realistic user journeys — login, navigation, data loading, transactions.
- Configure the environment: Set up network throttling, select target devices, and confirm your baseline is documented.
- Run tests: Execute load, stress, and endurance tests. Capture CPU usage, memory consumption, battery drain, and response time data throughout.
- Analyze results: Compare against your thresholds and baseline. Identify which metrics failed and under what conditions.
- Fix issues: Address the highest-impact problems first — memory leaks and crash-causing bottlenecks before UI jank or minor latency.
- Retest and integrate: Rerun the full test suite after fixes. Integrate performance tests into your CI/CD pipeline so regressions are caught automatically on every build.
Common Performance Issues and How to Fix Them
Most mobile performance problems fall into a handful of recurring categories. Knowing what to look for cuts diagnostic time significantly.
Memory Leaks
Memory leaks occur when objects are retained in memory after they're no longer needed — often due to strong reference cycles, unremoved listeners, or static references to Activity/ViewController contexts. Xcode Instruments' Leaks tool and Android Profiler's memory heap snapshots both surface these. The fix is usually architectural: reviewing lifecycle management and adopting weak references where appropriate.
Slow Rendering and UI Jank
Frames that drop below 60fps are visible to users as jank. The usual culprits are heavy work on the main thread, unoptimized layouts, or excessive overdraw. Android Profiler's rendering track and Xcode's Core Animation instrument both identify frame drops. Moving expensive operations to background threads and flattening view hierarchies resolves most cases.
Excessive Battery Drain
Apps that poll APIs too frequently, hold wake locks unnecessarily, or run location services in the background consume battery at rates users notice within hours. Audit background tasks, batch network requests where possible, and use platform-appropriate background execution APIs (WorkManager on Android, BackgroundTasks on iOS).
API Latency and Network Inefficiency
Slow backend responses compound with mobile network variability. Implement request caching, reduce payload sizes with compression, and design for graceful degradation when connectivity is poor. For crypto apps specifically, WebSocket connections for real-time data are far more efficient than repeated polling.
Frequently Asked Questions
What is the difference between performance testing and load testing for mobile apps?
Performance testing is the broad category covering all aspects of how an app behaves under various conditions — speed, stability, resource usage. Load testing is a specific type of performance test that measures behavior under a defined, expected volume of concurrent users or requests.
Should I test on real devices or emulators?
Both have a place in the workflow. Emulators are useful for rapid iteration during development. Real devices are required for accurate battery, thermal, and hardware-rendering results, especially before release. Aim for at least 2-3 physical devices representing your target audience's hardware range.
How often should mobile app performance testing be done?
Baseline performance tests should run on every significant build as part of a CI/CD pipeline. Full stress and endurance test suites are typically run before major releases or after significant backend changes.
What is an acceptable load time for a mobile app?
A cold start under 2 seconds is a widely cited target for mainstream apps. Screen transitions and in-app actions should complete in under 1 second to feel responsive. These numbers shift depending on app complexity — a feature-rich crypto trading terminal has different expectations than a simple utility app.
Can performance testing be automated in a CI/CD pipeline?
Yes. Tools like Appium, Firebase Test Lab, and JMeter all support headless execution and can be integrated into CI systems like GitHub Actions, Jenkins, or Bitrise. Automated regression testing in the pipeline ensures performance baselines are enforced on every build, not just before launch.
Performance testing isn't a one-time gate before release. It's an ongoing discipline — especially as apps grow in complexity, user base, and feature surface. Build it into your workflow early, and the cost of fixing issues stays manageable. Wait until launch, and you're playing catch-up with your own users.